Unit 2 Lesson 12- Discover a Data Story
Your Visualization
Paste your visualization in the space below.
Prompts:
Provide a brief description of the dataset you chose to visualize.
(approximately 50 words)
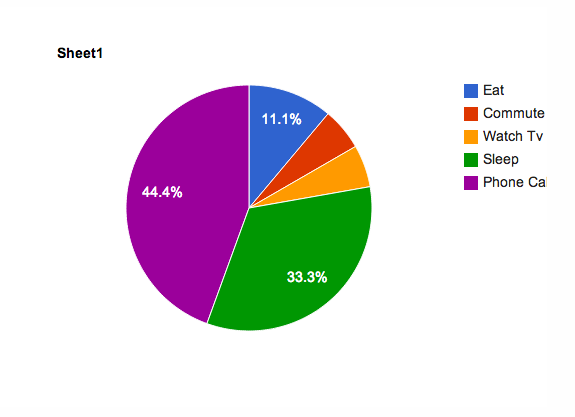
This dataset describes what people typically do When someone just wakes up, they tend to have a schedule and do the same things consistently. Data from the pie chart can represent either eating, commuting, watching tv, sleeping, and using their phones.
Describe the trend, pattern, or relationship you found within your data. How is it shown with your visualization?
(approximately 100 words)
The pattern show that most people sleep or talk on the phone in the morning. It shown that the biggest chunk of the pie chart is the phone calls. Based on this data, we can assume that most people would grab their phone and started using it right or sleep.
- Come up with a possible story or explanation for the trend you described. Make sure to note any assumptions you are making in this interpretation of the data.
(approximately 100 words)
A possible story could be that my brother, Eric, has done all of these things today, but talks on the phone for most of his morning and sleeps for most of his morning. We can assume that Eric is very lazy as he doesn’t want to do much involving movement and action. He would rather lie down in a bed and just be on his phone for hours. Eric is just like an ordinary teenager. Sleeping would also be important for when your mind and body need to be in the best condition.
Comments
Post a Comment